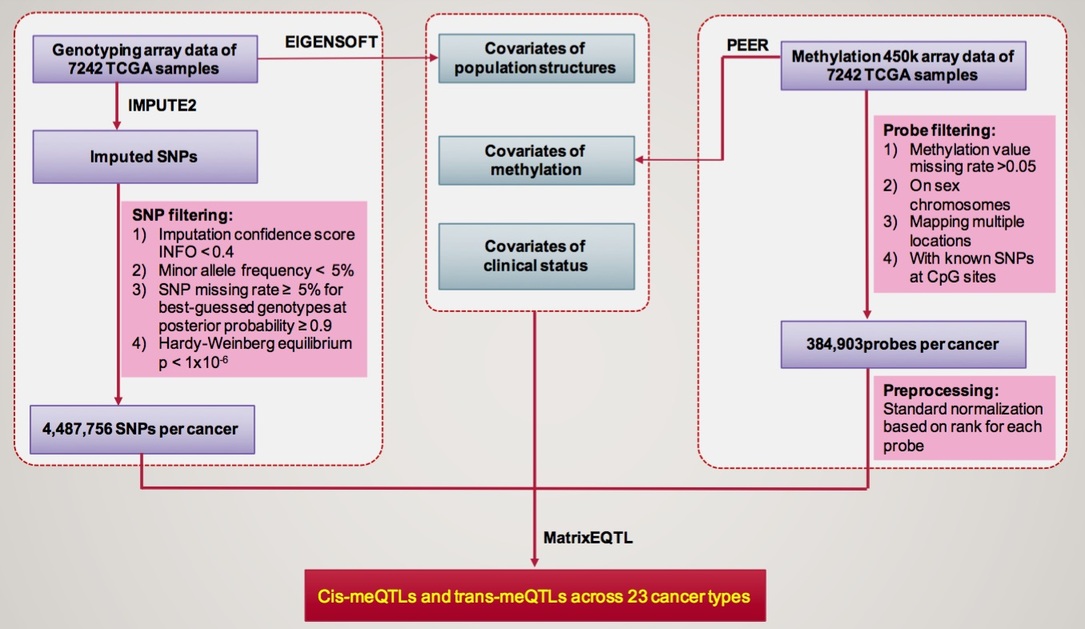
Pancan-meQTL is a database to provide a comprehensive resource of methylation quantitative trait loci (meQTLs) for 23 human cancer types in TCGA with sample size larger than 100.
In Pancan-meQTL, users can:
|
Cancer type
|
Full name
|
No. of samples
|
No. of methylaiton probes
|
No. of genotypes
|
Cis-pairs
|
Cis-meProbes
|
Cis-meQTLs
|
Trans-pairs
|
Trans-meProbes
|
Trans-meQTLs
|
|---|---|---|---|---|---|---|---|---|---|---|
| BLCA | Bladder Urothelial Carcinoma | 405 | 384903 | 4182865 | 502774 | 8136 | 301392 | 216341 | 46165 | 51295 |
| BRCA | Breast invasive carcinoma | 664 | 384084 | 2721411 | 340881 | 7289 | 203391 | 47355 | 1804 | 31118 |
| CESC | Cervical squamous cell carcinoma and endocervical adenocarcinoma | 290 | 383425 | 4289322 | 531458 | 11284 | 318082 | 212025 | 48741 | 46185 |
| CRC | Colon adenocarcinoma + Rectum adenocarcinoma | 354 | 380594 | 3879590 | 555556 | 10781 | 316517 | 185943 | 40872 | 55402 |
| ESCA | Esophageal carcinoma | 173 | 382712 | 4357977 | 408020 | 15726 | 260629 | 21790 | 5427 | 13297 |
| HNSC | Head and Neck squamous cell carcinoma | 501 | 385146 | 4245789 | 706915 | 10590 | 392427 | 100579 | 16599 | 51195 |
| KIRC | Kidney renal clear cell carcinoma | 306 | 384916 | 4487756 | 827668 | 14184 | 455287 | 598701 | 95277 | 82497 |
| KIRP | Kidney renal papillary cell carcinoma | 271 | 384786 | 4827856 | 830528 | 14986 | 486170 | 232041 | 52484 | 58017 |
| LAML | Acute Myeloid Leukemia | 122 | 385529 | 5121896 | 408043 | 10758 | 283314 | 22473 | 606 | 17201 |
| LGG | Lower Grade Glioma | 487 | 385198 | 4611830 | 789126 | 11092 | 454090 | 151792 | 24257 | 61737 |
| LIHC | Liver hepatocellular carcinoma | 367 | 383962 | 4152031 | 449509 | 9378 | 272962 | 127824 | 28610 | 46149 |
| LUAD | Lung adenocarcinoma | 448 | 384670 | 4343043 | 525439 | 8848 | 297745 | 110266 | 19790 | 52156 |
| LUSC | Lung squamous cell carcinoma | 359 | 385034 | 3676672 | 598237 | 10039 | 334937 | 191909 | 44240 | 60597 |
| PAAD | Pancreatic adenocarcinoma | 177 | 382517 | 4989296 | 903193 | 24432 | 513599 | 120777 | 41820 | 34727 |
| PCPG | Pheochromocytoma and Paraganglioma | 175 | 385235 | 4701955 | 589160 | 19388 | 385289 | 34905 | 2175 | 23719 |
| PRAD | Prostate adenocarcinoma | 479 | 385067 | 4801718 | 1129044 | 16366 | 574577 | 188046 | 46160 | 66084 |
| SARC | Sarcoma | 257 | 382095 | 4083674 | 458278 | 14059 | 287992 | 64709 | 22198 | 24734 |
| SKCM | Skin Cutaneous Melanoma | 103 | 384364 | 4838338 | 200763 | 6689 | 150232 | 8399 | 399 | 6332 |
| STAD | Stomach adenocarcinoma | 367 | 383290 | 4265676 | 687004 | 10723 | 382962 | 77711 | 9612 | 49489 |
| TGCT | Testicular Germ Cell Tumors | 148 | 385618 | 4807863 | 470576 | 14871 | 309018 | 36183 | 3791 | 25912 |
| THCA | Thyroid carcinoma | 498 | 385449 | 4842972 | 830377 | 11908 | 477575 | 248274 | 36261 | 72317 |
| THYM | Thymoma | 120 | 385609 | 4940146 | 562478 | 17015 | 352356 | 28228 | 1981 | 22009 |
| UCEC | Uterine Corpus Endometrial Carcinoma | 171 | 385407 | 4961809 | 314774 | 14181 | 218421 | 17953 | 2911 | 12881 |
|
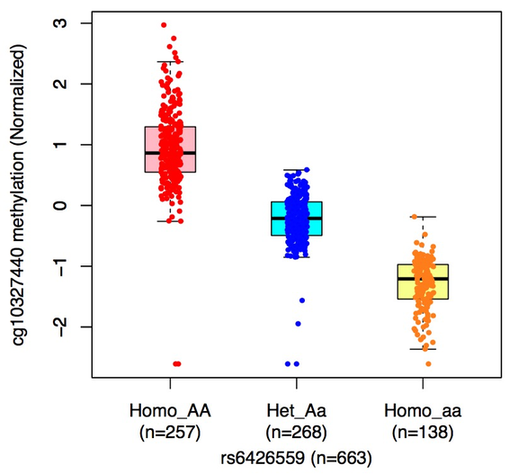
meQTL boxplot
|
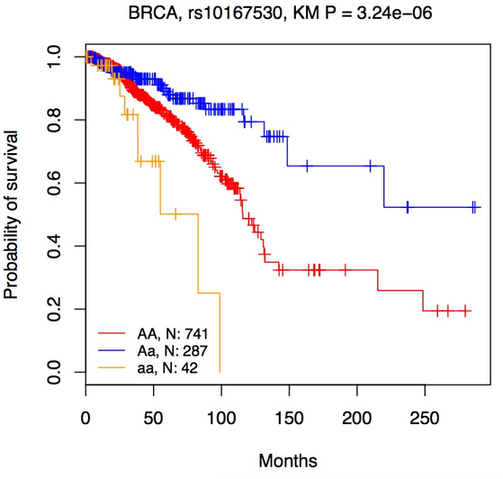
Kaplan-Meier plot
|
|---|---|
|
 |
|
Boxplots represent the methylation levers in individuals carrying homozygote AA, heterozygous Aa, and homozygote aa, respectively. |
Lines represent the survival curve for individuals carrying homozygote AA, heterozygous Aa, and homozygote aa, respectively. |
GWAS tagSNPs were downloaded from GWAS catalog website (http://www.ebi.ac.uk/gwas/) and the GWAS linkage disequilibrium regions were extracted from SNAP database (https://personal.broadinstitute.org/plin/snap/ldsearch.php). meQTLs that overlapp with tagSNPs and/or linkage disequilibrium regions were extracted as GWAS-related meQTLs.
CPRIT (Cancer Prevention Research Institute of Texas) Scholar
Email:
Department of Biochemistry & Molecular Biology
The University of Texas Health Science Center at Houston, Houston, 77030 USA
Email:

Department of Epidemiology and Biostatistics
School of Public Health, Tongji Medical College
Huazhong University of Science and Technology, Wuhan 430074 P.R. China